
As genetic genealogists, forensic professionals, and law enforcement investigators work with increasingly large and complex family trees, the tools they use to explore these structures must evolve. Traditional tree visualizations struggle to scale, especially when a single GEDCOM file includes thousands (or even tens of thousands) of individuals. The Othram forensic genetic genealogy team, the largest full-time team of its kind, has first-hand seen trees grow beyond 10,000 people as investigators link together distant relatives, cluster matches, and build extended family networks to resolve difficult cases.
That’s why we built a new global view for Othram Maps.
From Overwhelming to Intuitive
In a standard graph-based layout, zooming out on a tree with thousands of nodes creates visual and operational chaos: overlapping connections, unreadable names, and performance bottlenecks. Our new global view replaces this clutter with a bubble plot that abstracts the full graph into meaningful, interpretable clusters.
Each bubble represents a region of the family tree with a high density of individuals. The size and color of a bubble reflect how many people are in that cluster, offering an immediate visual sense of structure and scale across the tree.
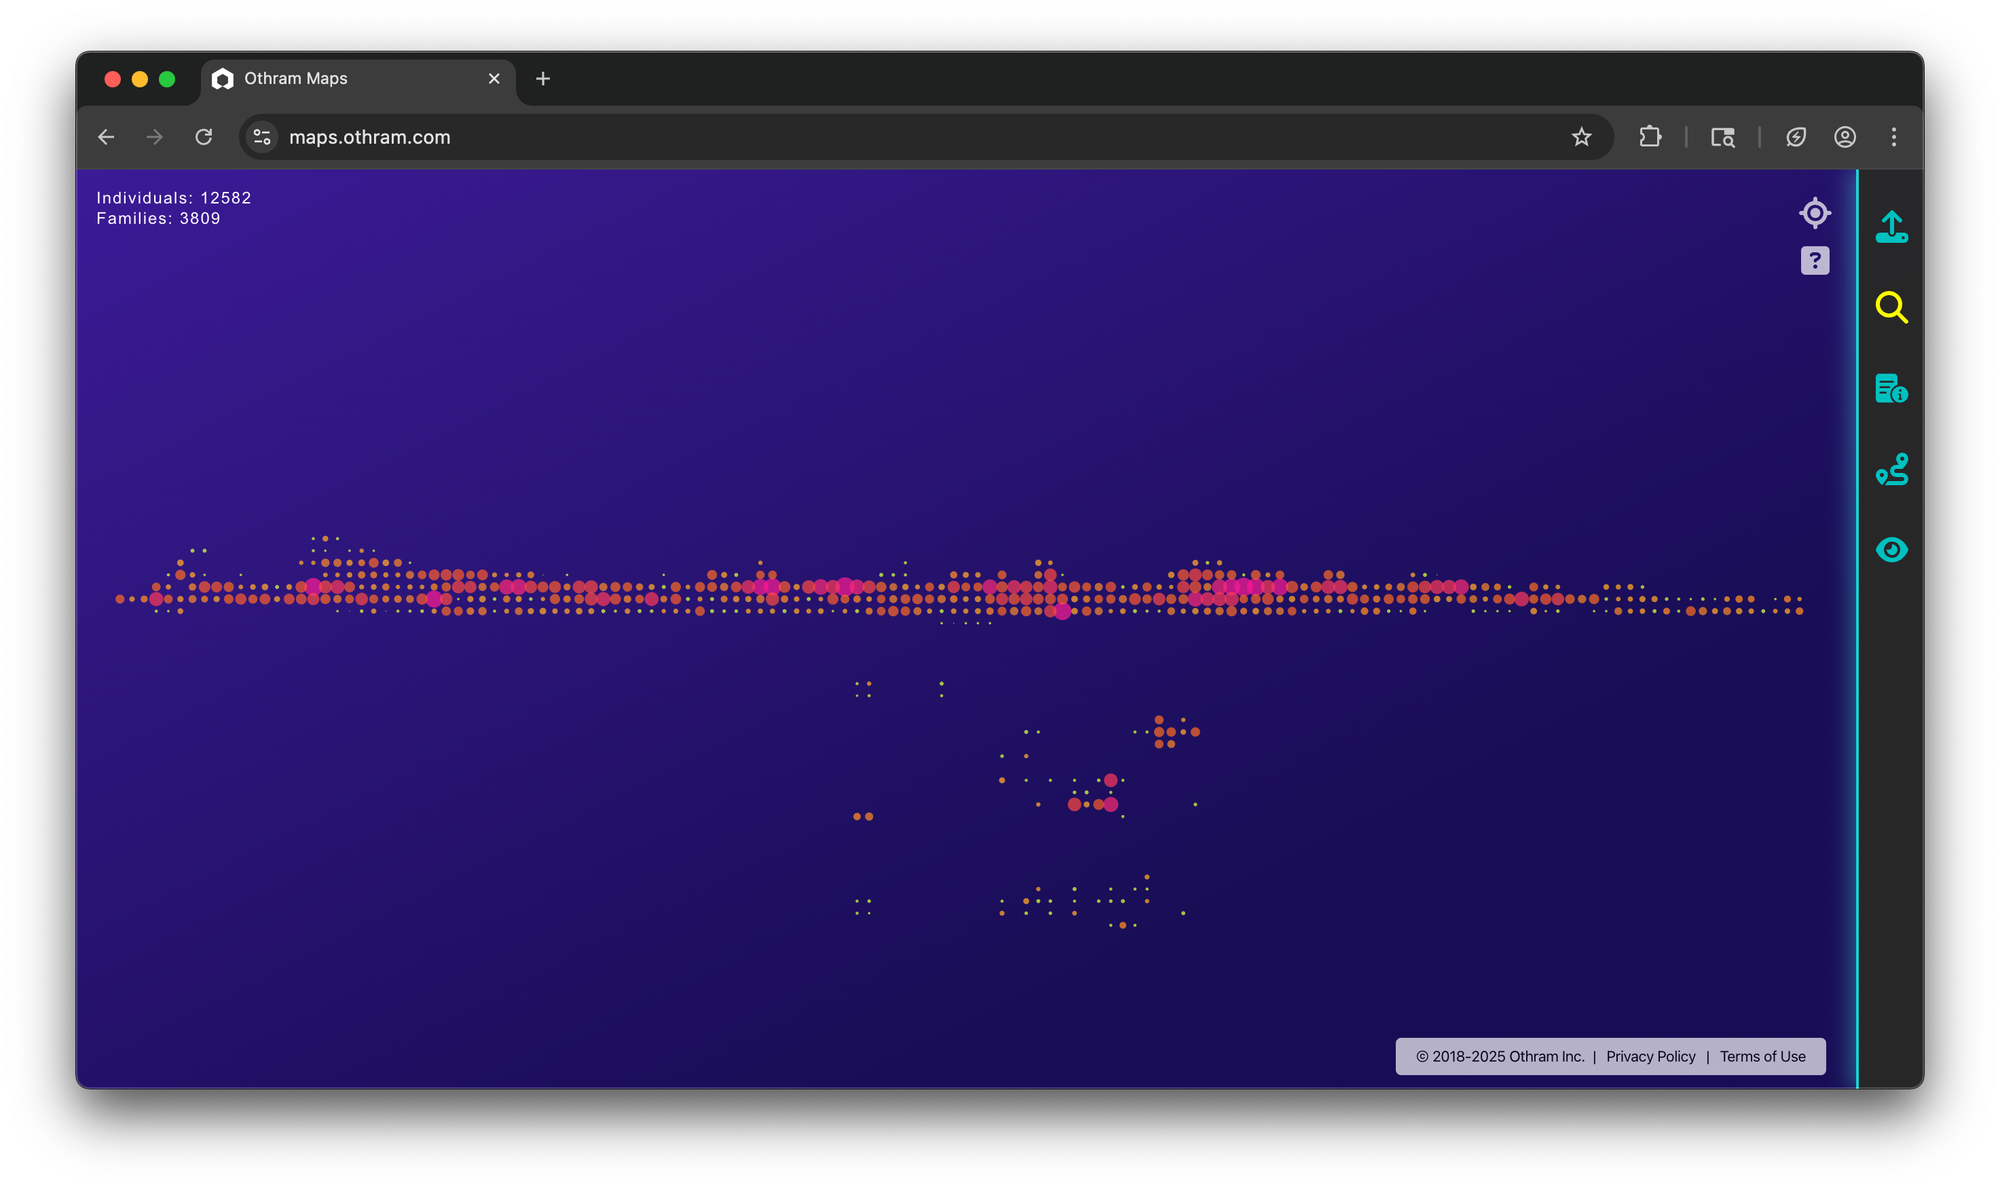
In the example above, a GEDCOM with over 12,000 individuals is visualized. Rather than trying to show each person and relationship all at once, the global view gives a clean, high-level overview. It is fast, interactive, and meaningful—even at the largest scales.
Seamless Zoom and Transition
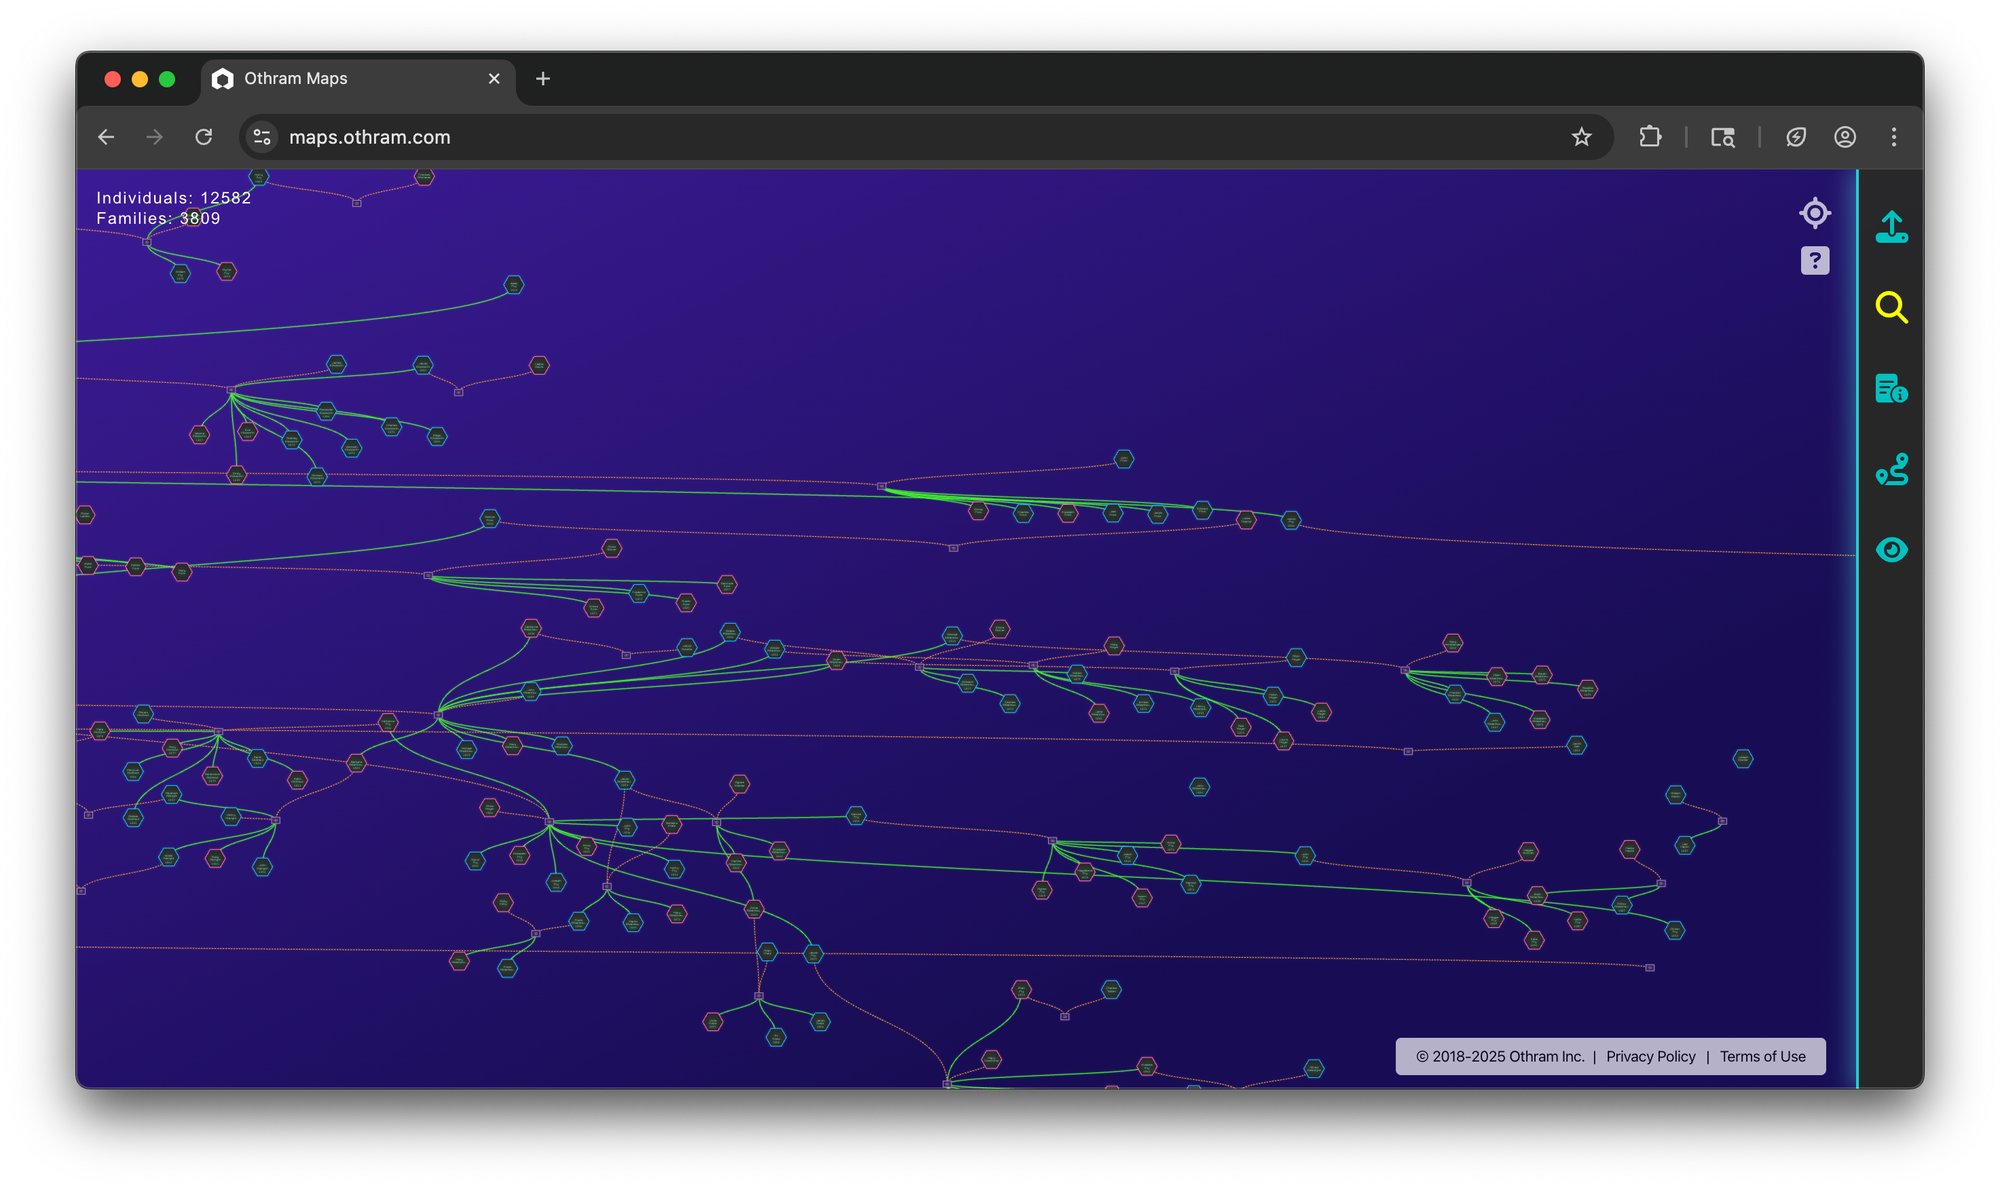
What makes the global view especially powerful is its interactivity. By clicking or tapping a bubble, or zooming in, the system transitions seamlessly back into the standard Othram Maps view, with the standard hexagonal nodes and relationship lines that enable fine-grained exploration. Hovering over a bubble gives contextual information about the number of individuals and families represented in that region.
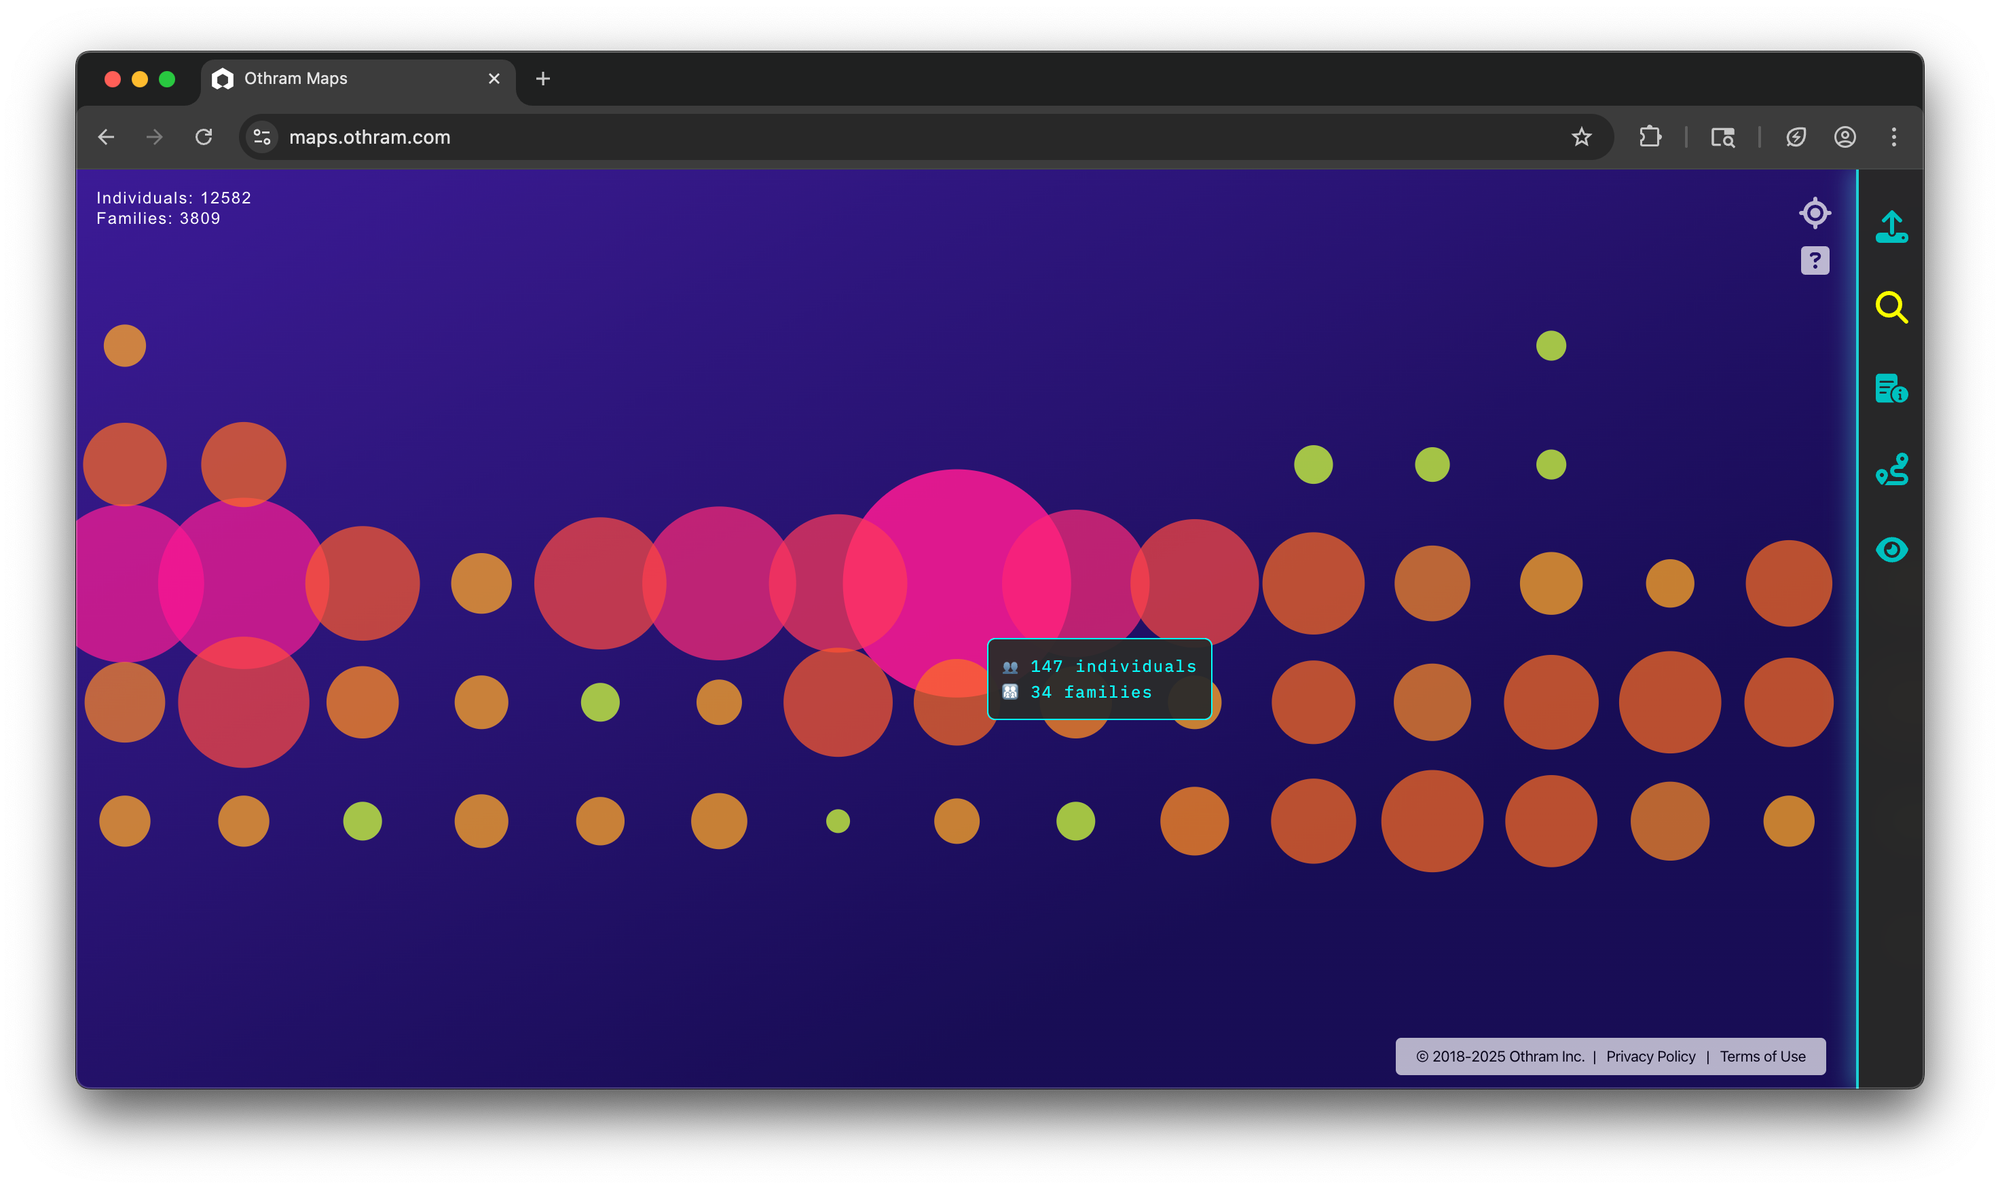
This layered approach allows users to move smoothly between macro-level context and micro-level detail. A tree can be scanned for structural insights at a glance, then can be zoomed into a specific region to follow the connections between individuals. For example, zooming in to or selecting the larger pink bubble reveals the view below.
Load-on-Demand for Massive Graphs
Another major challenge in working with large family trees is rendering them smoothly, especially on consumer devices like tablets or mobile phones. When a tree has tens of thousands of nodes and relationships, trying to load everything at once leads to sluggish performance and browser crashes.
To solve this, we rebuilt the Othram Maps interface with load-on-demand technology. Instead of drawing the entire graph upfront, the interface loads tiles of the tree dynamically, only rendering nodes and edges near the current location in the graph. By panning or zooming, new parts of the tree load automatically.
This feature keeps the interface responsive and memory-efficient, even for trees with tens of thousands of individuals—and it works seamlessly across desktops, tablets, and mobile devices.
A Smarter Recenter Button
A recenter icon is situated at the top-right corner of the screen.
Clicking this button returns the screen to a “home” view. On smaller trees, that means zooming out to see the entire graph. On large trees, it switches to the global bubble view, fitting all clusters neatly to the screen. This feature makes it easy to reorient the tree, no matter how deeply the tree has been navigated.
Pro Tips for Desktop Users
On a desktop, Othram Maps also supports a set of keyboard shortcuts that make navigation even faster. Press ? at any time to bring up a reference overlay with commands for searching, toggling the sidebar, and moving directionally across the graph view or the global view. The recenter feature can be activated by pressing H on the keyboard.
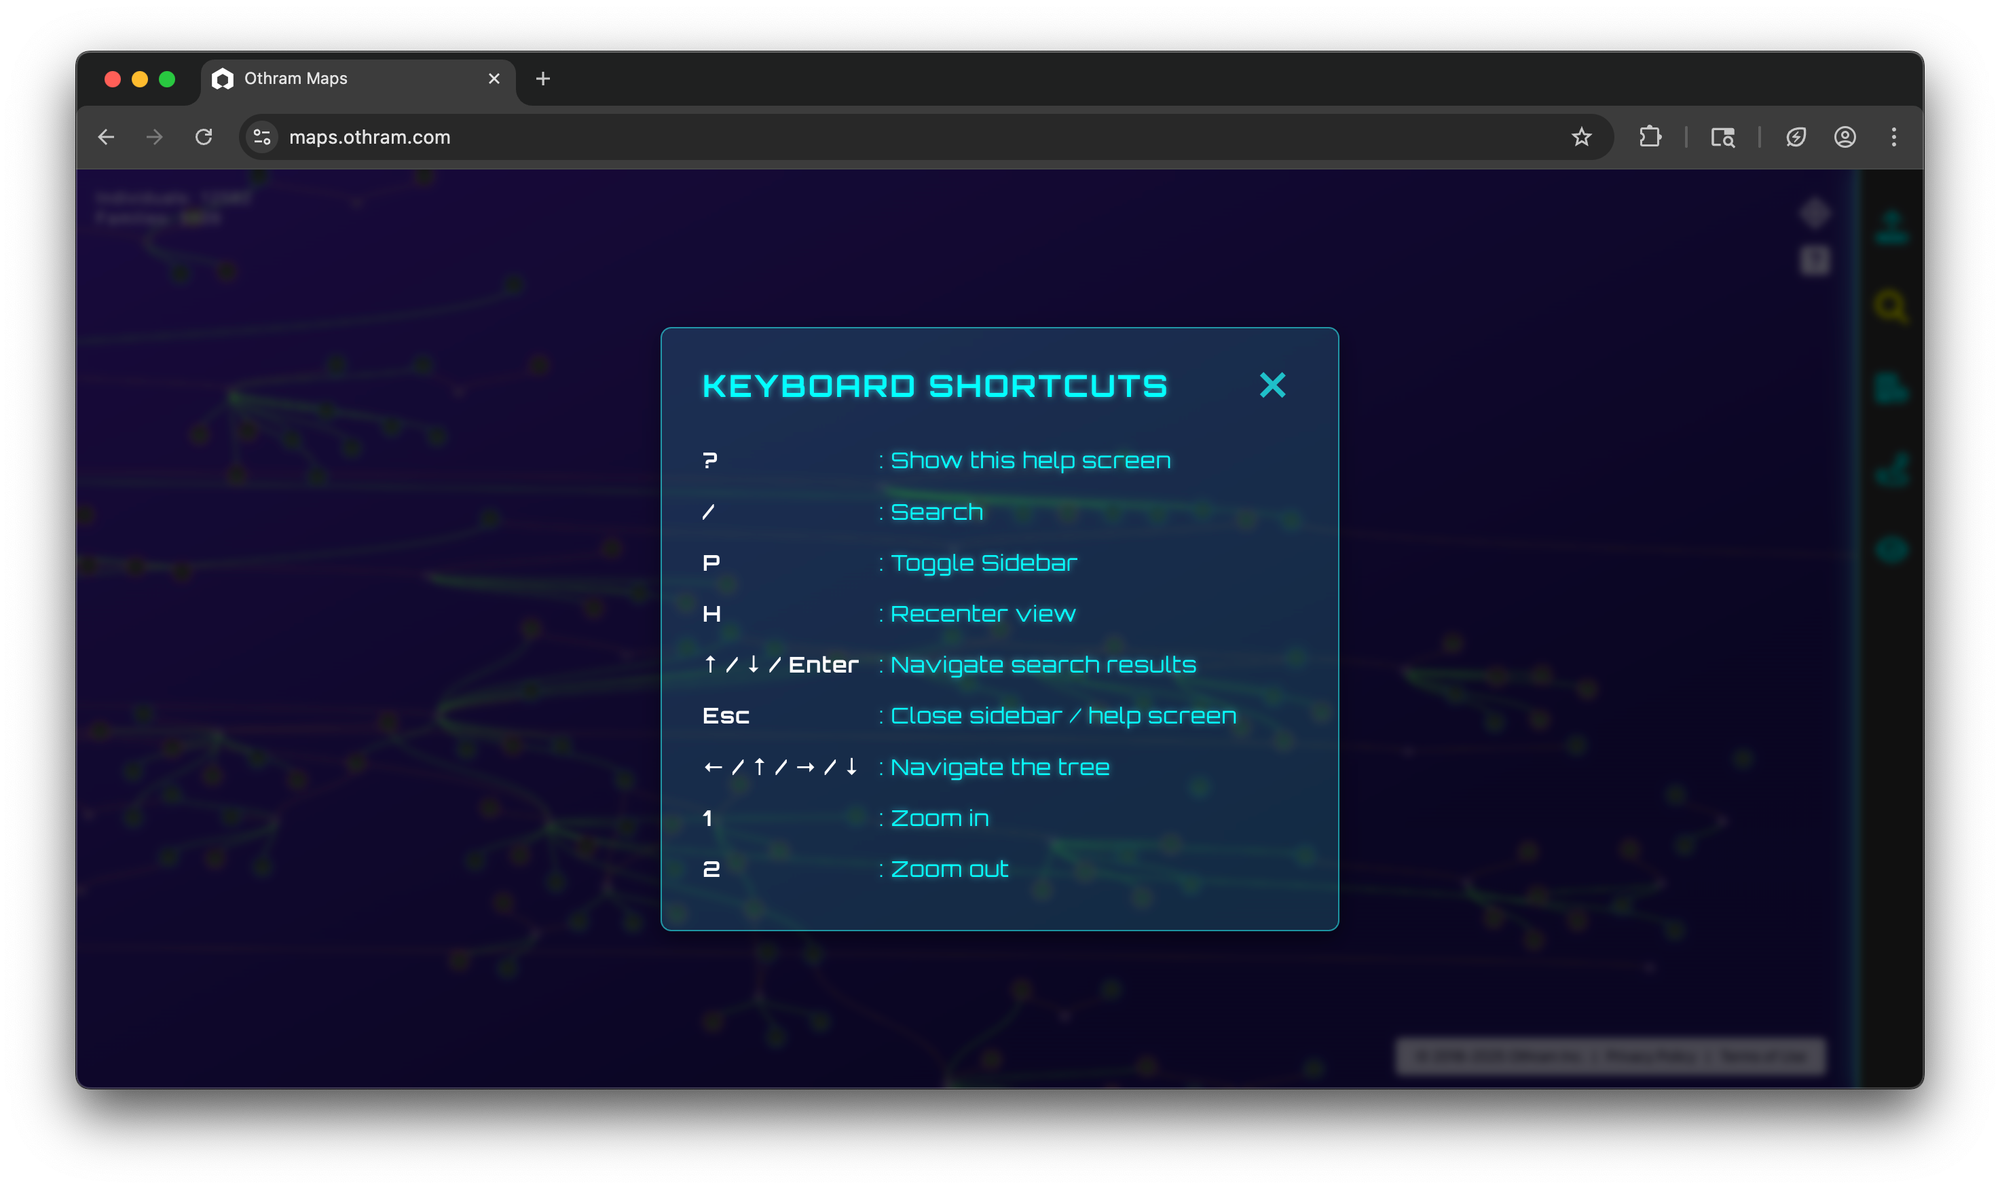
These shortcuts are especially helpful when working with large trees or conducting detailed genealogical analysis.
Built for the Future of Forensic Genetic Genealogy
As forensic genetic genealogy continues to expand, we expect trees to keep growing in size, in complexity, and in investigative value. The features introduced here are not just about making Othram Maps faster; they are designed to make the entire process of genealogical research more scalable, accessible, and intuitive for professionals and researchers alike.
The global view, load-on-demand rendering, recenter feature, and keyboard navigation features are all live now in Othram Maps. If you are working with large GEDCOMs—or even modest-sized ones—we hope these updates make your exploration faster, smoother, and more insightful.
Want to try it out? You can explore Othram Maps right now for free!


